Would you like us to feature your project? Let us know!
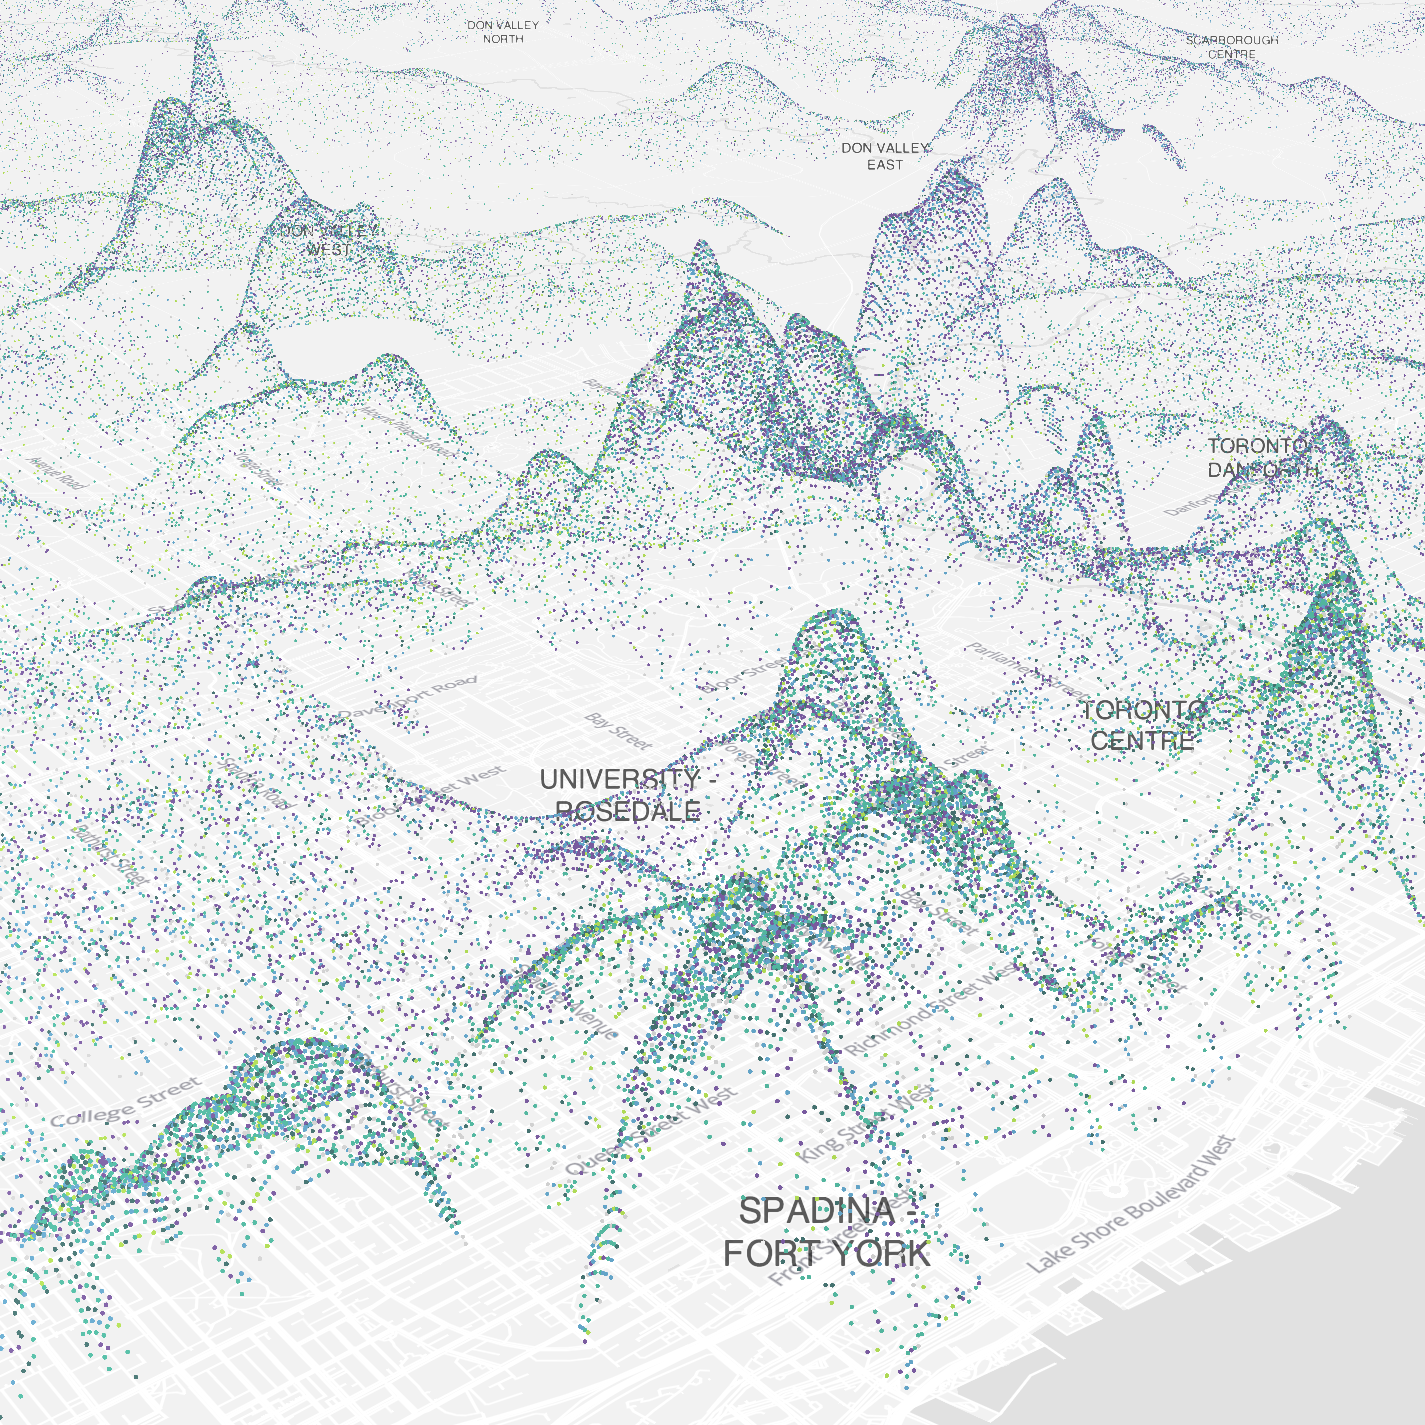
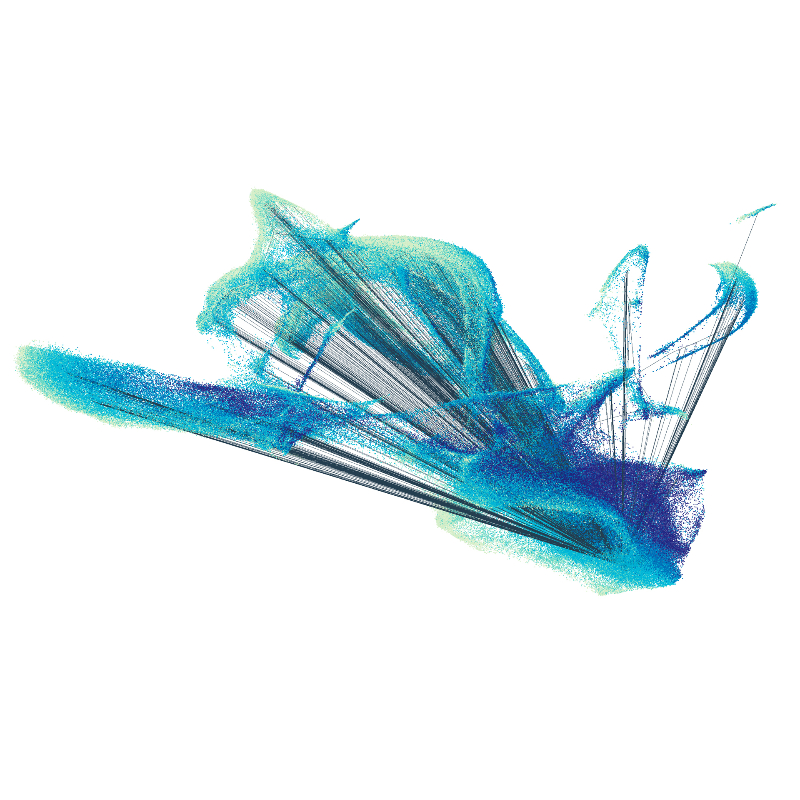
Toronto Dot Density Map
Dot density map for Toronto, Canada, visualizing population density in 3D by rendering dots as a point cloud layer.

Taxo&Map Biodiversity Map
by Geomatico
Biodiversity world map to browse the collections of the Natural Science Museum of Barcelona and other institutions. It loads of a dataset of 200,000 points with GPU filtering, providing high interactivity and refresh rates.
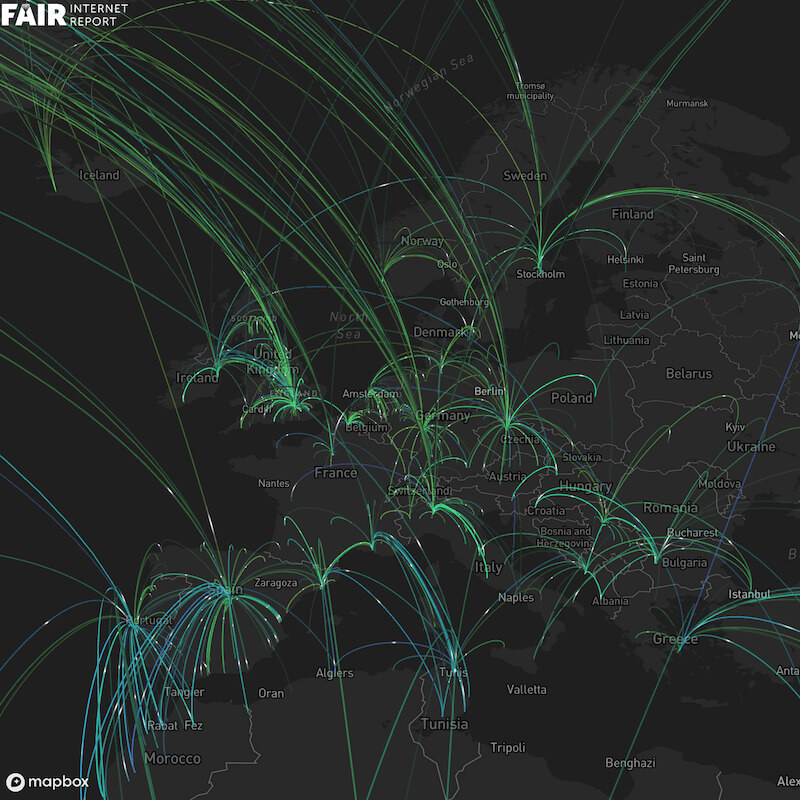
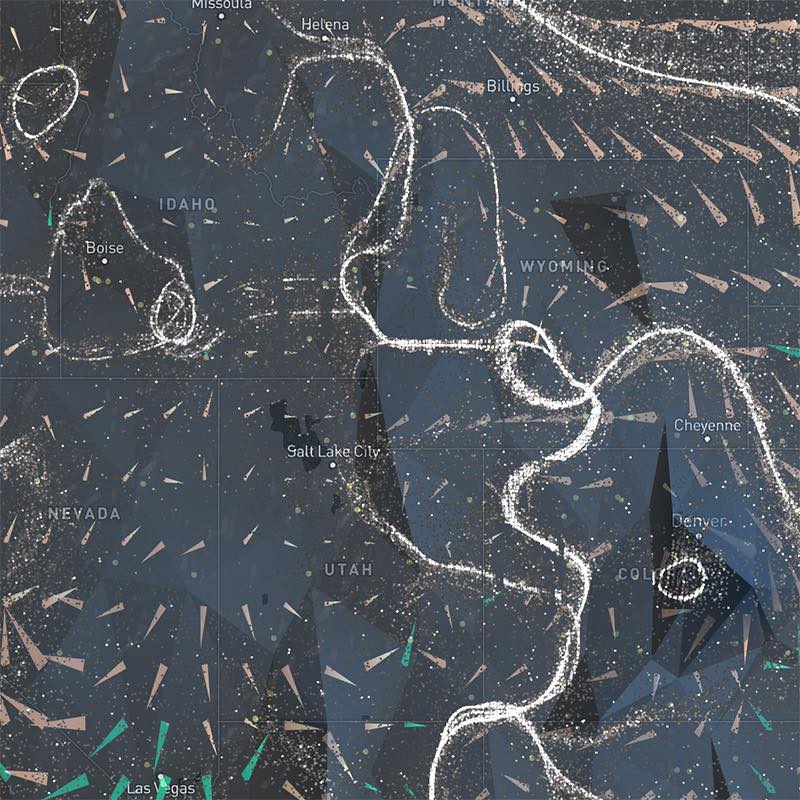
Internet Speed Tests Map
An interactive map displaying 3.6 million speed tests from a single day in June 2023, animated seamlessly over a responsive MapBox layer. Deck.gl's performance and custom shaders ensure the animations run smoothly and vividly. Data is efficiently loaded from a binary format and accessed with array offsets in JavaScript for optimal performance.
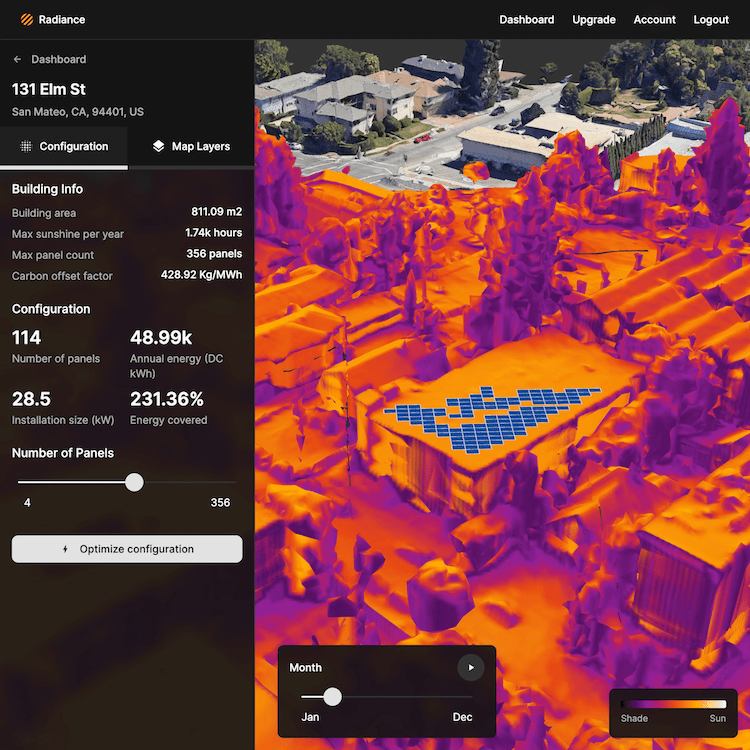
Radiance: solar panel positioning optimization
by Radiance
An interactive tool for panel density layout optimization and financial modeling for solar projects. Uses Google 3D tiles rendered in deck.gl to show realistic immersive environment. Visualize solar flux and hourly shade images on top of the 3D tiles.
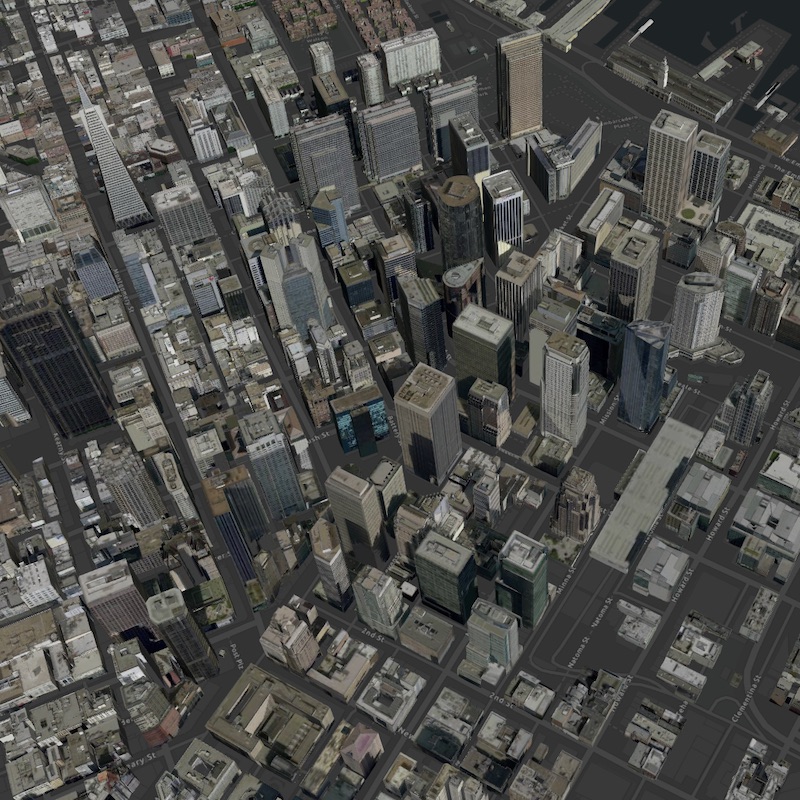
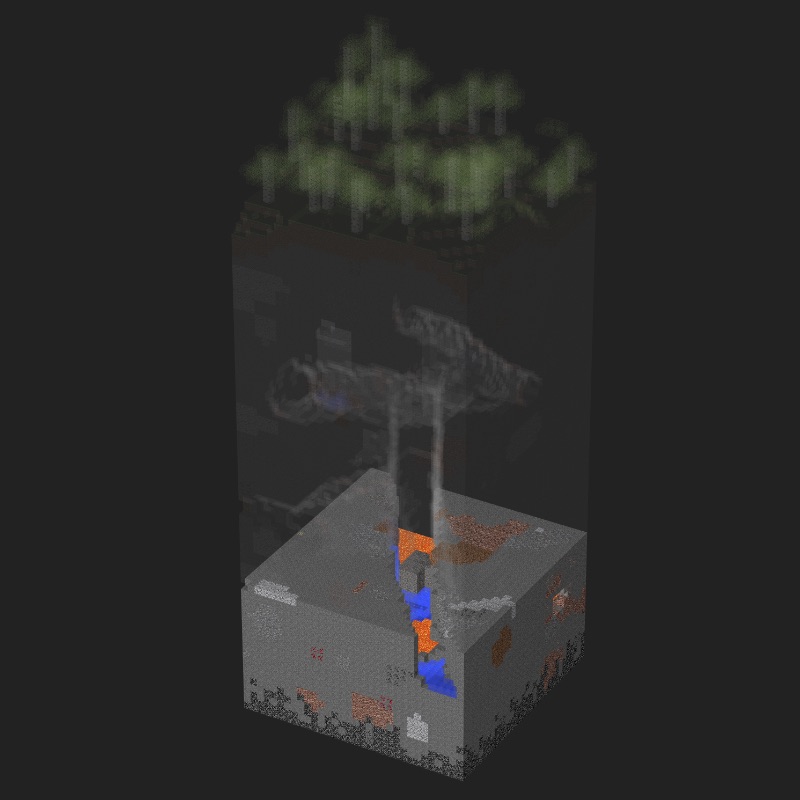
I3S Explorer
Visualization and Debug Tool for I3S 3D geographic data
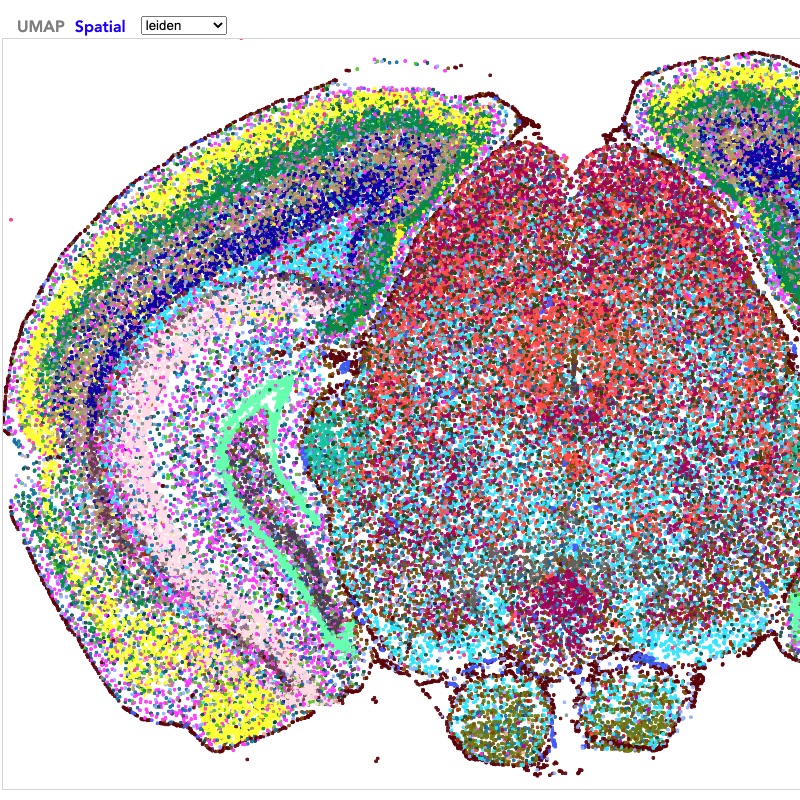
Vizgen Single-Cell MERFISH Spatial Visualizer
by Vizgen
Vizgen's Interactive Single-Cell Spatial Visualizer enables users to explore single-cell gene expression data from our MERFISH Mouse Brain Receptor Map. Cells can be visualized using a UMAP embedding or the spatial coordinates within the brain - providing a detailed spatial map of the tissue.
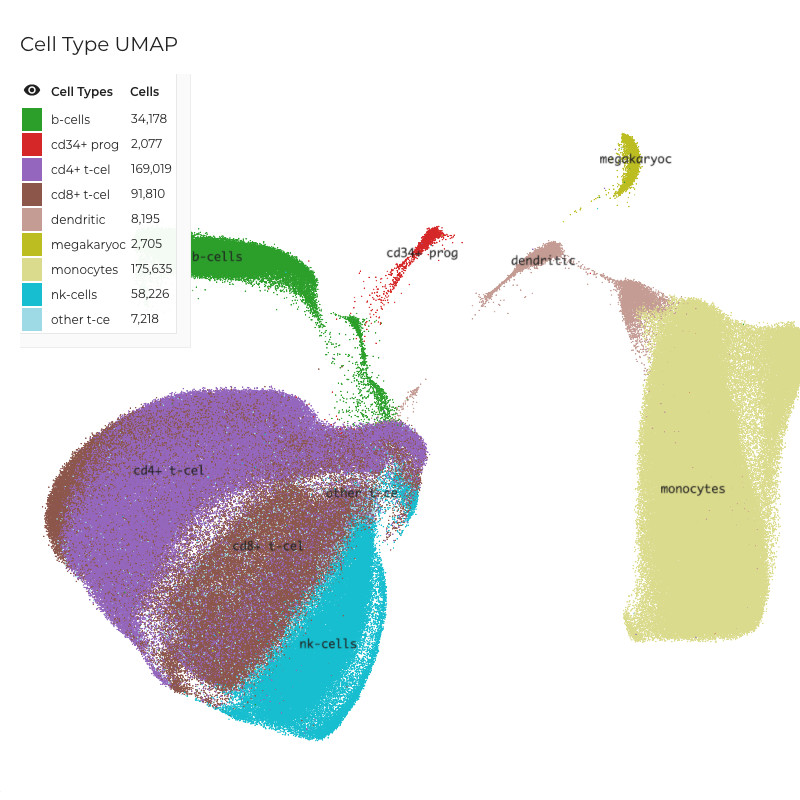
ISB Covid19
by Data Visualization Center at Fred Hutch
The Institute for Systems Biology Covid19 Atlas provides insights into how the immune system responds with disease progression. The website features single-cell multi-omics time-series data as well as clinical annotations on more than 400 patients.
Descartes
by Data Visualization Center at Fred Hutch
Understanding the trajectory of a developing human requires understanding of how genes are regulated and expressed. The Descartes Human Cell Atlases features the largest single cell dataset generated to date. It contains data on ~5 million individual cells that when analyzed provides a comprehensive atlas of early human development.
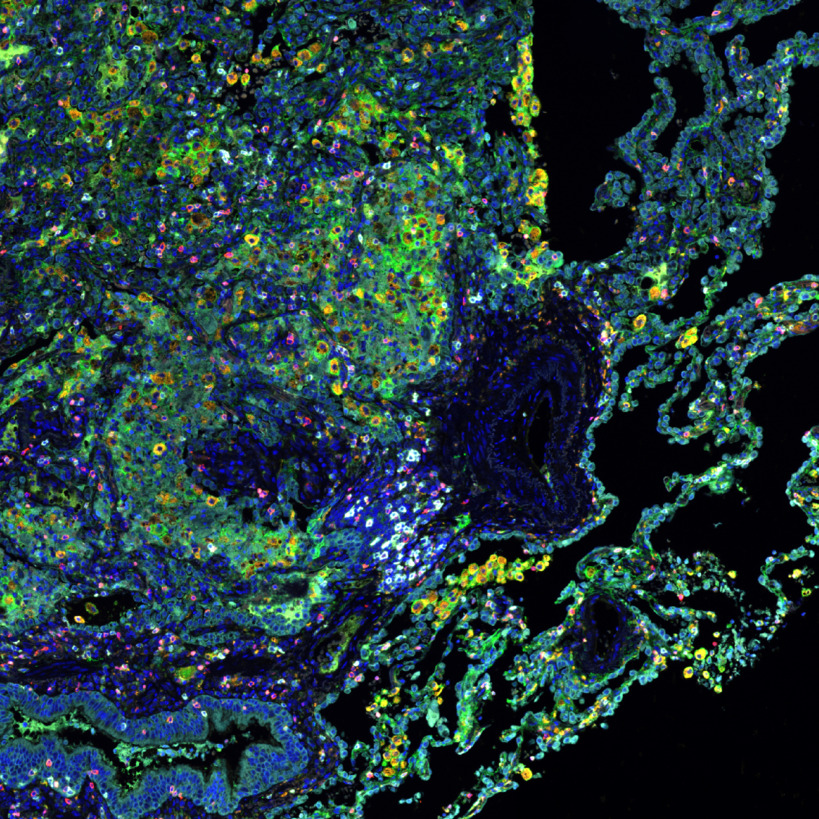
Viv
Source code | by Gehlenborg Lab/Harvard Medical School
Viv is a library for multiscale visualization of high-resolution, highly multiplexed bioimaging data on the web. It directly renders data in Bio-Formats-compatible Zarr and OME-TIFF formats. Avivator is a lightweight image viewer that showcases the capabilities of Viv. The development of Viv and Avivator was supported with funding from the National Institutes of Health and Harvard University.
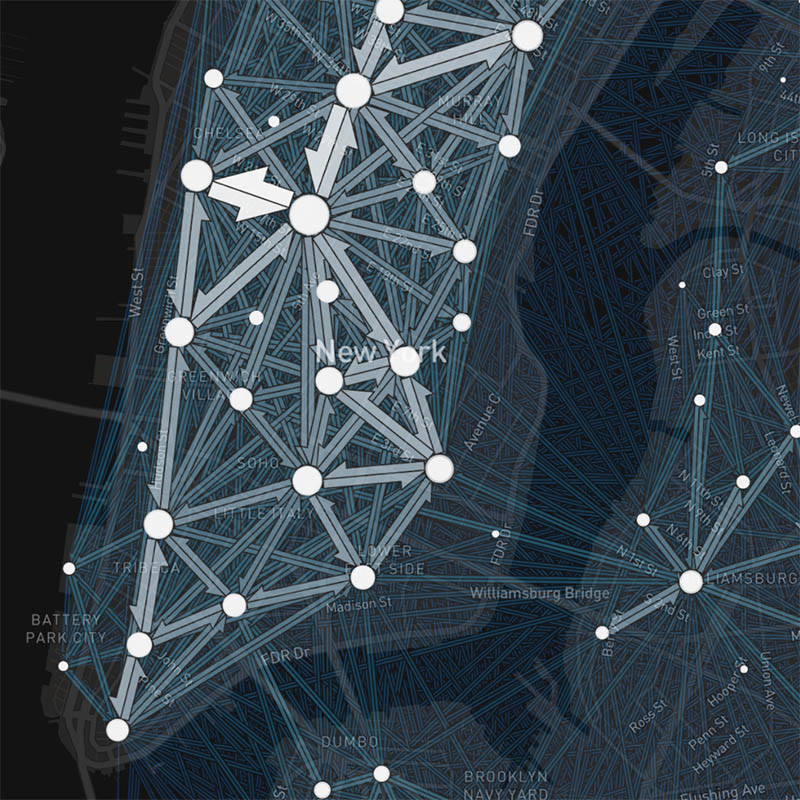
Flowmap.blue
Source code | by Ilya Boyandin
Flowmap.blue is a free tool for representing aggregated numbers of movements between geographic locations as flow maps. It is used to visualize urban mobility, commuting behavior, bus, subway and air travels, bicycle sharing, human and bird migration, refugee flows, freight transportation, trade, supply chains, scientific collaboration, epidemiological and historical data and many other topics.
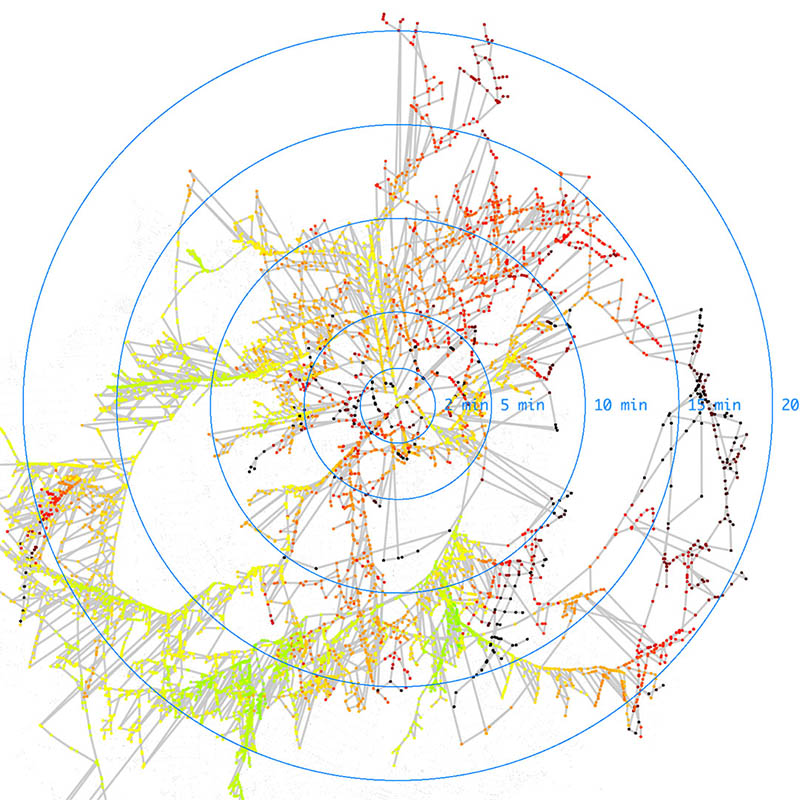
Isochronic Map
Source code | Blog post | Blog post 2
Remapping road network in major cities by travel times.
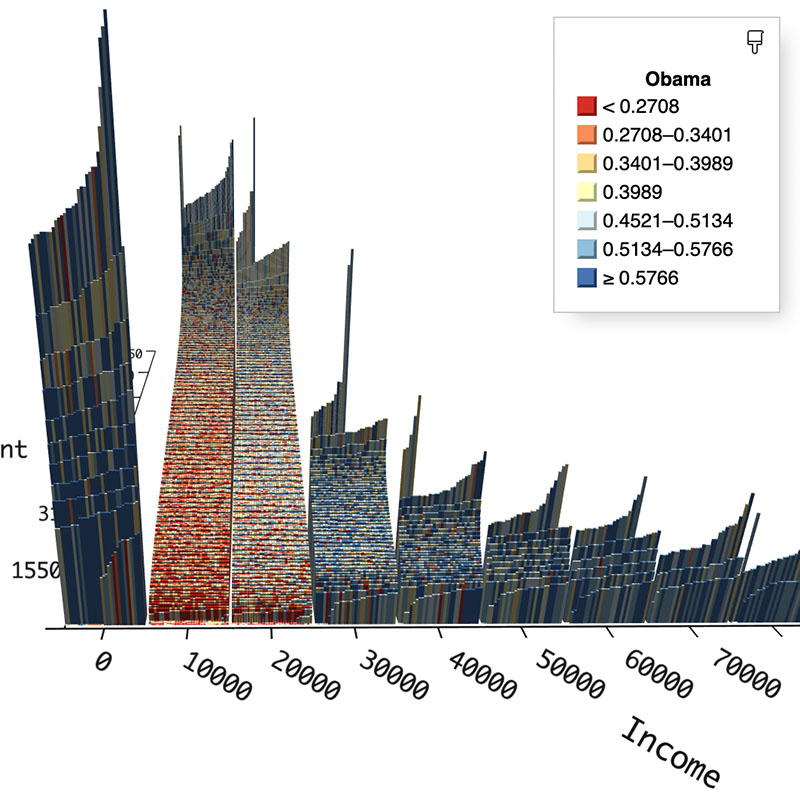
Simulating the 2016 Primary
An interactive visualization of the 2016 Presidential primary election in Maricopa County that uses polling place operations research to simulate election day lines and voter walkoffs in real time.
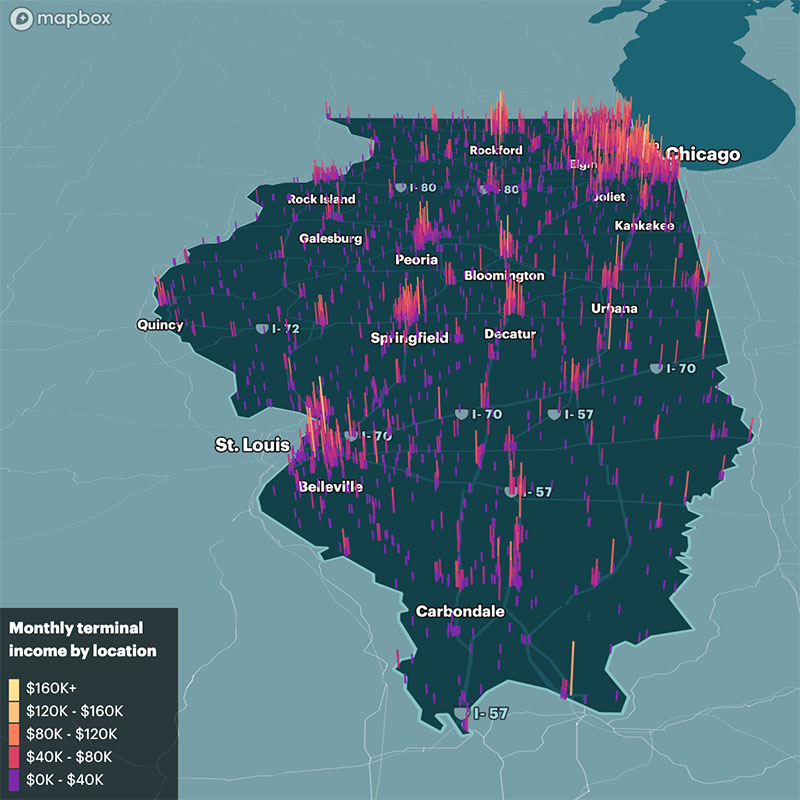
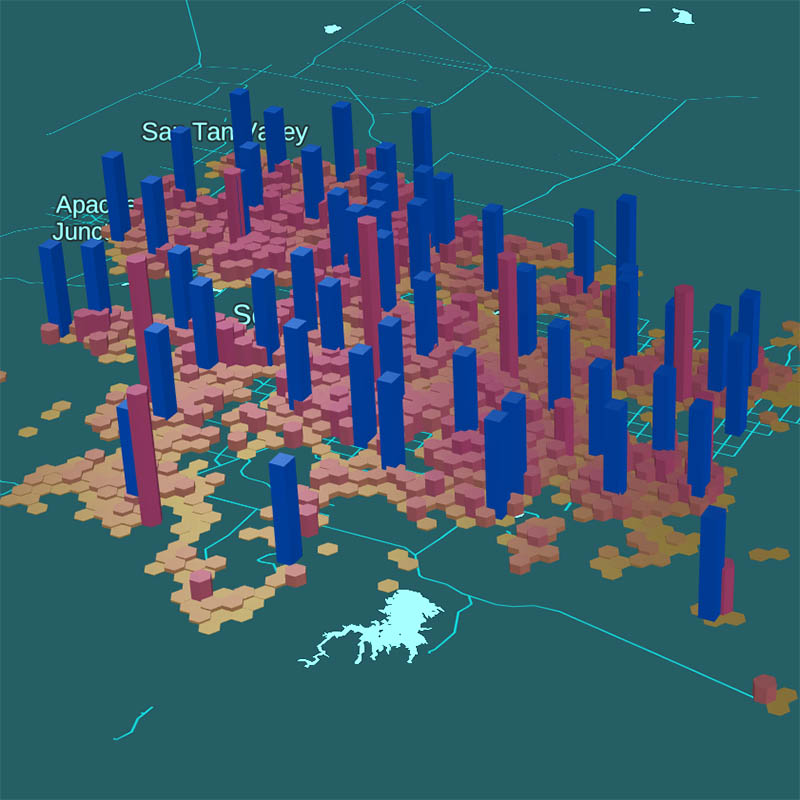
The Bad Bet
Data journalists use deck.gl to visualize how the revenue generated by video gambling machines in Illinois grow over time and how those revenues failed to meet the projections of legislators.
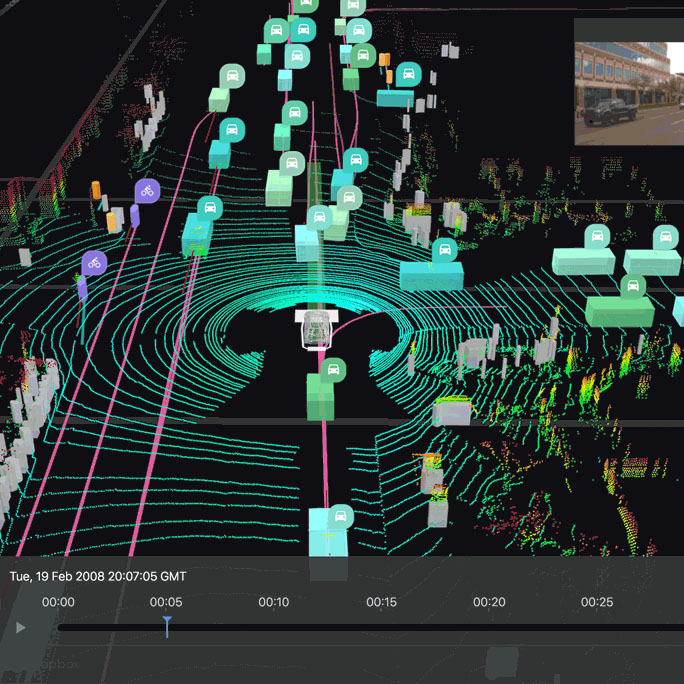
Autonomous Visualization System
A visualization protocol and toolkit for robotics data in the browser.
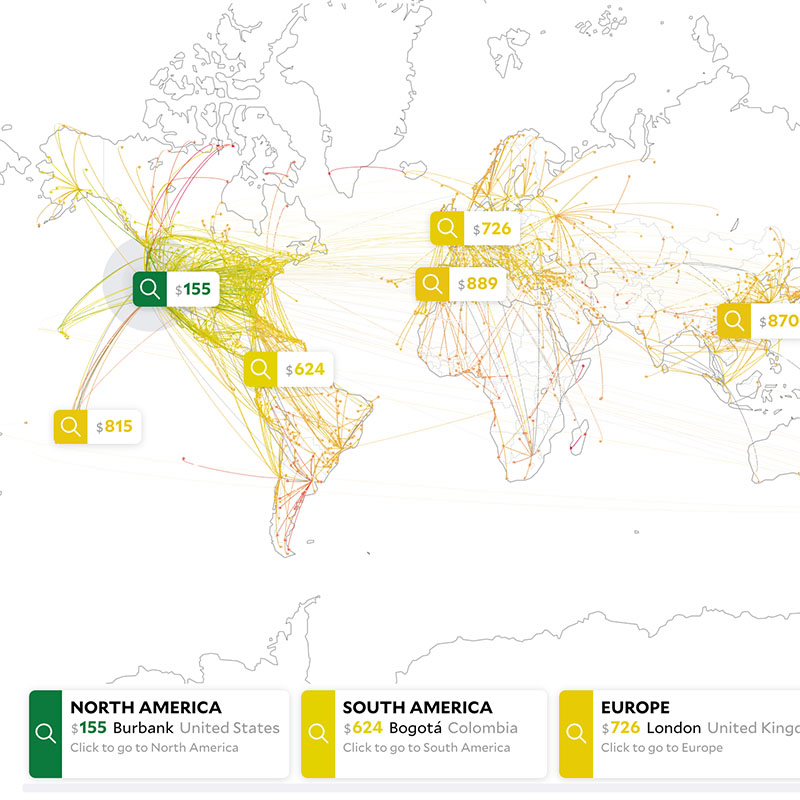
Escape
MIT Senseable City Laboratory, Singapore | About
Escape is an inspirational flight search engine that helps you choose a destination and find the cheapest flight for your next vacation.
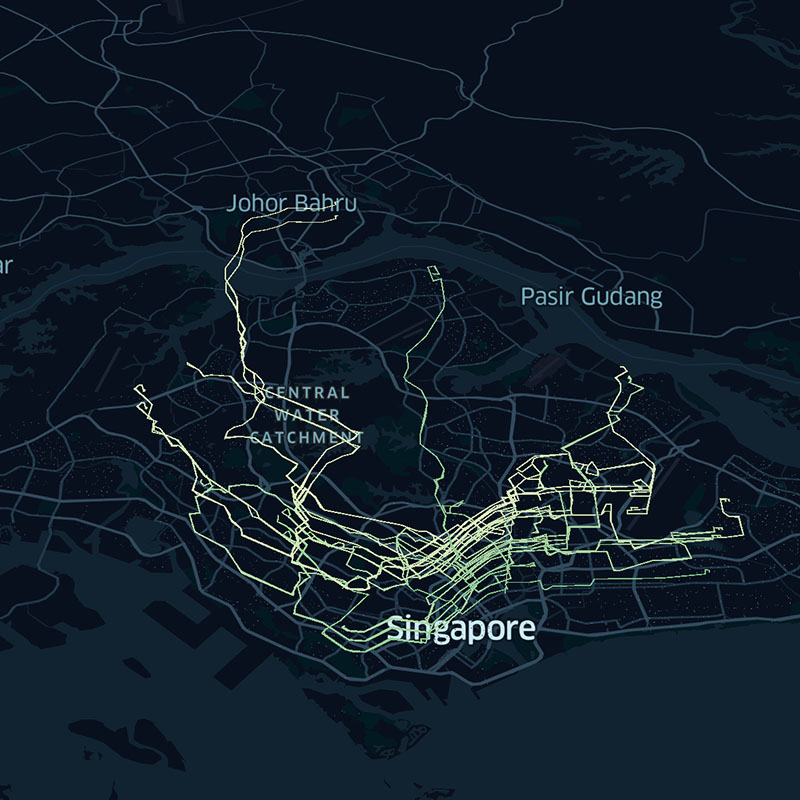
BusRouter SG
by cheeaun | data © Land Transport Authority | GitHub
Explore bus stops and routes on the map for all bus services in Singapore, with realtime bus arrival times and per-bus-stop passing routes overview.
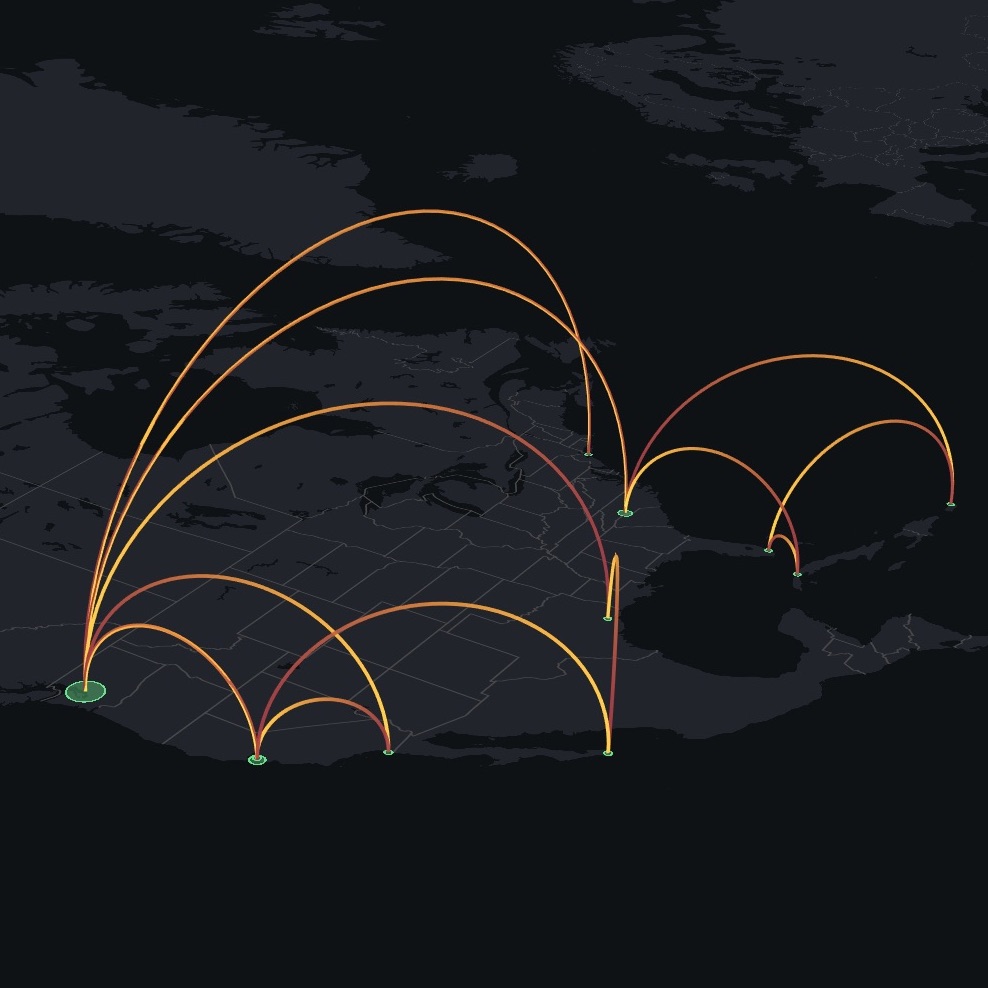
FlightMapper
by Dylan Babbs | Example map
Map and explore your flight history with interactive visualizations and analytics.
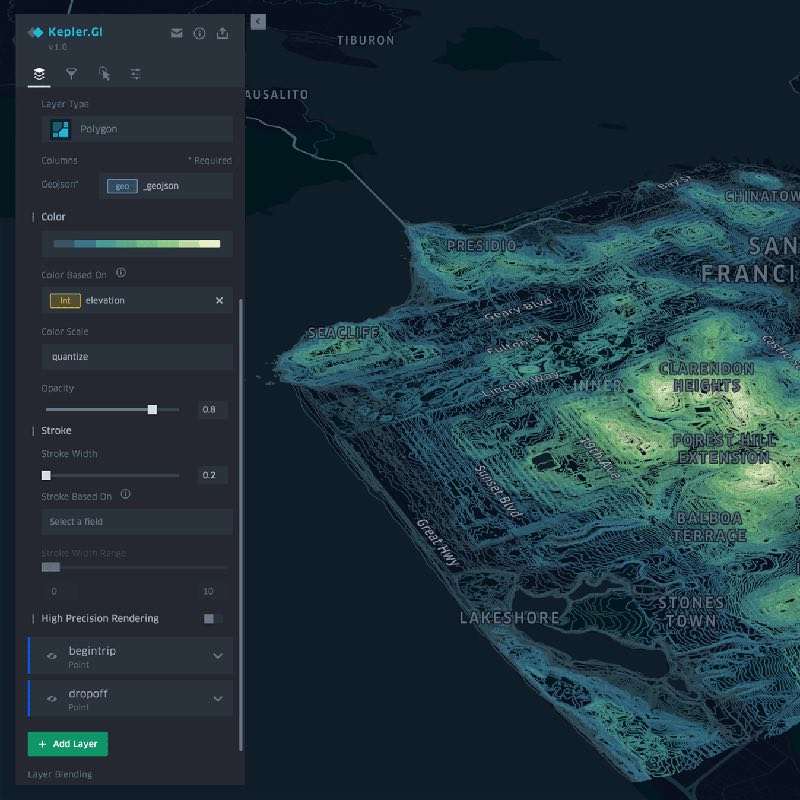
Kepler.gl
Kepler.gl is a powerful web-based geospatial data analysis tool. Built on a high performance rendering engine and designed for large-scale data sets.

Ascii Video Player
Uses the TextLayer API to convert pixels into characters on the fly. WebGL2 compatible browser is required.